App Market Research: A Practical Playbook for Product Teams
Run app market research that actually de-risks your product. Step-by-step playbook covering TAM, competitors, interviews, and go/no-go decisions.
By Sanket Sahu
28th Sep 2026
Last updated: 28th Sep 2026
The popular advice is to “research the market thoroughly” before building an app. That sounds responsible, but it often produces a larger spreadsheet, not a better decision. App market research should function as a go/no-go engine, connecting market size, observed behavior, competitor economics, and prototype assumptions into one document your team can defend.
The market is large, but size alone won't protect a weak product. In 2025, app-store and Google Play downloads reached an estimated 106.9 billion, while consumer spending rose 21.6% year over year to $155.8 billion (TechCrunch reports on 2025 app activity). Users still discover enormous numbers of apps, yet revenue increasingly depends on conversion, retention, subscriptions, and in-app purchases.
Your job isn't to prove that mobile is attractive. Your job is to determine whether this product, for this user, through these channels, can earn enough repeated behavior to justify building it.
Why Most App Market Research Wastes Time
Research often assumes that more information leads to better decisions. Analysts build competitor tables, paste market totals into a presentation, scan reviews, and schedule another meeting. The work feels rigorous because it produces artifacts, but it avoids the uncomfortable question: what finding would make us stop?
Research wastes time when it becomes a substitute for commitment. A founder keeps investigating adjacent audiences instead of testing the original one. A product manager gathers feature requests without ranking user value. A designer collects opinions about a polished concept, then mistakes enthusiasm for evidence. By the time the report reaches engineering, nobody knows which assumption matters most.
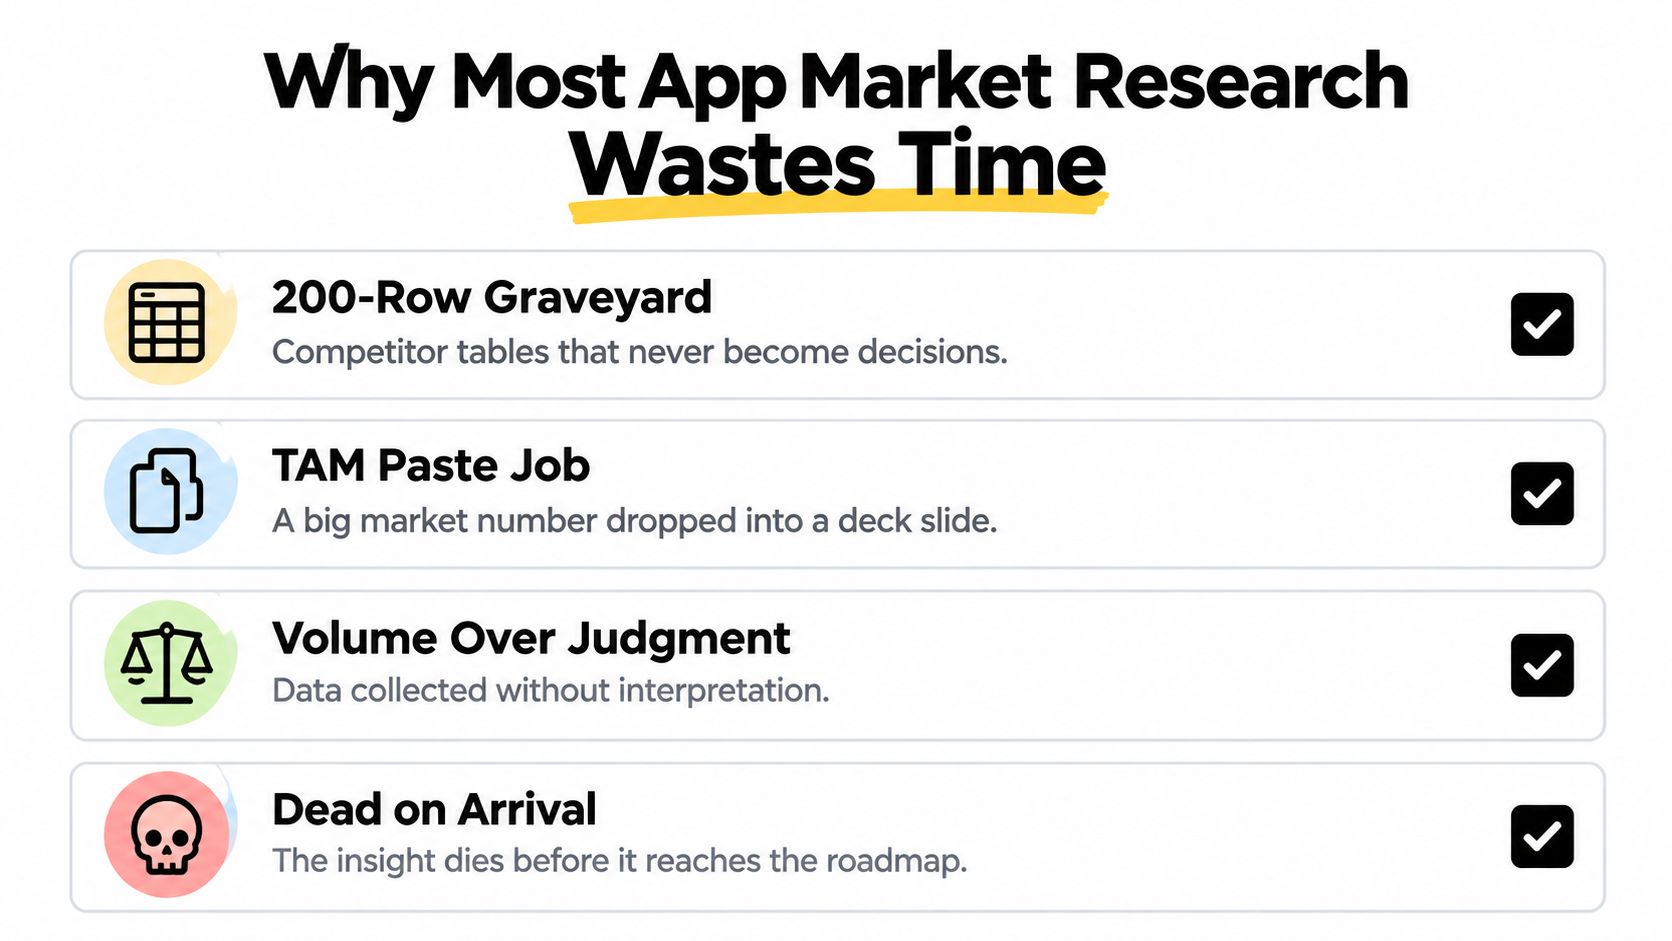
Four failure modes to eliminate
- Research as procrastination: The team keeps collecting evidence because no one wrote a decision deadline or stop rule.
- Curiosity without boundaries: The project expands from one user segment into enterprise buyers, international markets, and unrelated categories.
- Opinion presented as demand: “I'd use this” gets treated as stronger evidence than a current workaround, payment, search, or repeat behavior.
- Insight disconnected from delivery: Findings sit in a deck while the roadmap continues unchanged.
A useful guide to reducing rework reinforces the operational point. The earlier you expose a bad assumption, the less expensive it is to change direction. In app market research, that means testing the riskiest belief before investing in a full feature set, brand system, or production architecture.
Practical rule: Every research activity must answer a named product question or disappear from the plan.
Treat the work as a sequence of small, reversible decisions. First, decide whether the problem is urgent for a defined user. Then test whether existing alternatives leave a meaningful gap. Next, test whether your proposed behavior can retain users and support a viable monetization model. The output isn't “more research.” It's a commitment with explicit conditions.
Defining the Goal, Hypothesis, and Research Boundary
Start before opening App Store Connect, Google Play, Sensor Tower, or a survey tool. Write a one-sentence goal tied to a decision, not a topic. “Understand the wellness app market” is too broad to guide work. “Decide whether to prototype a daily meal-planning flow for busy parents in the next sprint” gives the team something concrete to evaluate.
Then write a falsifiable hypothesis. It needs a threshold, an audience, and a behavior that could prove you wrong. For example, you might test whether at least 40% of surveyed users in a defined segment report paying for a competing solution weekly. That exact threshold is only useful if the sample matches the intended audience and the question concerns real behavior, not a hypothetical purchase.
Put the boundary in writing
A boundary protects the project from attractive distractions. Define the geography, platform, persona, problem, monetization range, and research deadline. State exclusions with equal clarity: no enterprise interviews, no markets outside North America, and no pricing validation above $19 per month, if those limits fit your decision.
Include a stop rule. If the evidence misses the threshold, the team should halt, pivot the audience, or revise the problem before building. A conditional result can still support a prototype, but only when the condition names the next test and its pass criteria.
Your deliverable should be a one-page brief that a stakeholder can read in two minutes:
| Field | Example Entry |
|---|---|
| Research goal | Decide whether to prototype onboarding for a specific user segment |
| Core hypothesis | At least 40% of qualified users pay for a competing solution weekly |
| Audience | One clearly defined mobile-user segment |
| Geography | North America only |
| Platforms | iOS and Android, or one platform if evidence supports it |
| Out of scope | Enterprise buyers, unrelated personas, adjacent markets |
| Stop rule | Halt if behavior evidence and monetization signals miss the threshold |
| Decision date | A fixed date tied to the next product planning cycle |
| Owner | One person accountable for the verdict and prototype scope |
Keep the brief stable. You can revise the hypothesis when evidence changes your understanding, but record the change and why it happened. Silent scope changes make a weak idea look stronger than it is.
Sizing TAM, SAM, and SOM With Real Numbers
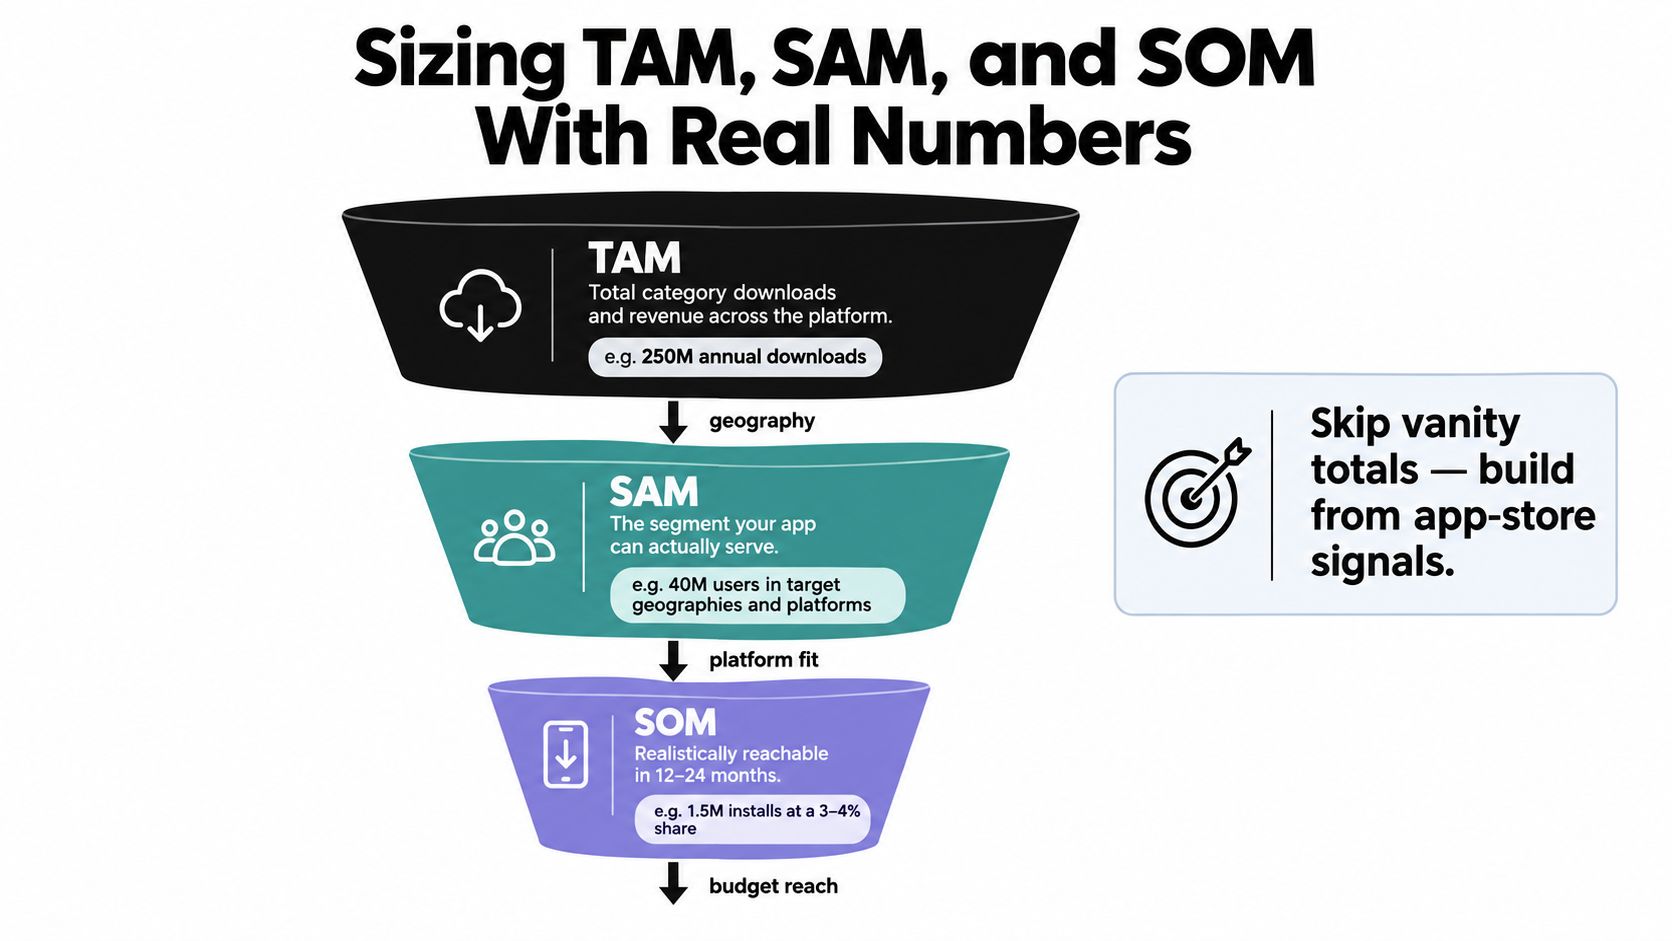
A global market total rarely tells leadership whether your app deserves a roadmap. Build the estimate from the closest app category, then filter it by geography, platform, user segment, acquisition access, and monetization fit.
TAM is the broadest useful universe, not a vanity headline. Use category-level downloads and revenue signals from app-intelligence providers such as Sensor Tower or data.ai, then compare them with category revenue references from Statista or eMarketer. SAM is the portion your product can serve. If your onboarding, payment model, language, or platform support excludes part of the category, remove it.
SOM is the number that should influence funding and staffing. Estimate what your distribution channels can reach, what your acquisition budget can support, and what retention and conversion assumptions allow. Don't claim a large share only because the category is growing. A defensible model shows a range and identifies the assumptions that create the range.
Build the estimate transparently
Use a simple sequence:
- TAM: Start with downloads, revenue, and active demand in the closest category.
- SAM: Apply your target geography, platform, audience, use case, and service constraints.
- SOM: Model reachable acquisition channels, expected conversion, repeat usage, and monetization.
- Sensitivity: Change the most uncertain input and observe whether the case still supports investment.
The broader ecosystem provides useful context, but it shouldn't replace your category model. Apple reported more than $1.4 trillion in billings and sales worldwide through its App Store ecosystem in 2025, alongside more than 850 million average weekly users across 175 countries and regions (Mordor Intelligence's mobile application market overview). Regional economics matter too, with reported 2025 App Store totals of $453 billion in the U.S., $562 billion in China, and $184 billion in Europe in billings and sales facilitated by the ecosystem.
Those figures establish platform reach, not your obtainable market. Your model must explain why your segment, channel, and product can capture demand inside that environment. If the case collapses when one acquisition or conversion assumption changes, don't hide the weakness in an average. Make that assumption the first item to validate with interviews and a prototype.
Use this explainer to show the model to non-financial stakeholders:
Competitor and Feature Gap Analysis That Goes Deeper
A feature checklist tells you what competitors have. It doesn't tell you why users choose them, how they acquire attention, or where a new product could win. Start with a positioning matrix that maps alternatives by target segment and primary monetization model.
Include direct competitors, adjacent apps, and failed or fading alternatives. For each one, capture the positioning statement, pricing tiers, three differentiators, acquisition channel, release cadence, ratings, and recurring complaints in recent reviews. App Store and Google Play listings provide the user-facing layer. App-intelligence snapshots can help you compare visibility and category movement, but don't treat estimated data as ground truth.
Score gaps by value and cost
A missing feature is not automatically an opportunity. Score each gap by the value it creates for the target user and the cost or complexity of delivering it. A social feature may appear frequently in competitor roadmaps but contribute little to the job your audience needs completed. A less visible improvement, such as faster setup or clearer progress feedback, may shift adoption more effectively.
| Competitor | Target Segment | Monetization Model | Top Differentiators | Recurring User Complaints | Feature Gap Score (0-5) |
|---|---|---|---|---|---|
| Direct alternative A | Defined core user | Subscription | Workflow, convenience, trust | Setup friction, limited export | |
| Direct alternative B | Defined core user | Freemium | Discovery, integrations, breadth | Paywall clarity, support gaps | |
| Adjacent alternative A | Neighboring user | Advertising or purchase | Familiar behavior, reach | Weak depth, inconsistent quality | |
| Failed or fading alternative | Former target user | Mixed | Earlier category advantage | Abandonment, stale experience |
The score should reflect user value, not executive excitement. Ask, “Would this change the decision to try, pay, or return?” If the answer is no, it belongs below the prototype cut line.
Look for repeated patterns across alternatives. Features that appear everywhere may be table stakes. Complaints that appear across several products can reveal a positioning opening, especially when they concern trust, setup, reliability, or unclear pricing. Your final matrix should identify two or three category expectations and one gap that connects directly to a behavior your interviews can test.
User Personas, Interviews, and Behavior Over Opinions
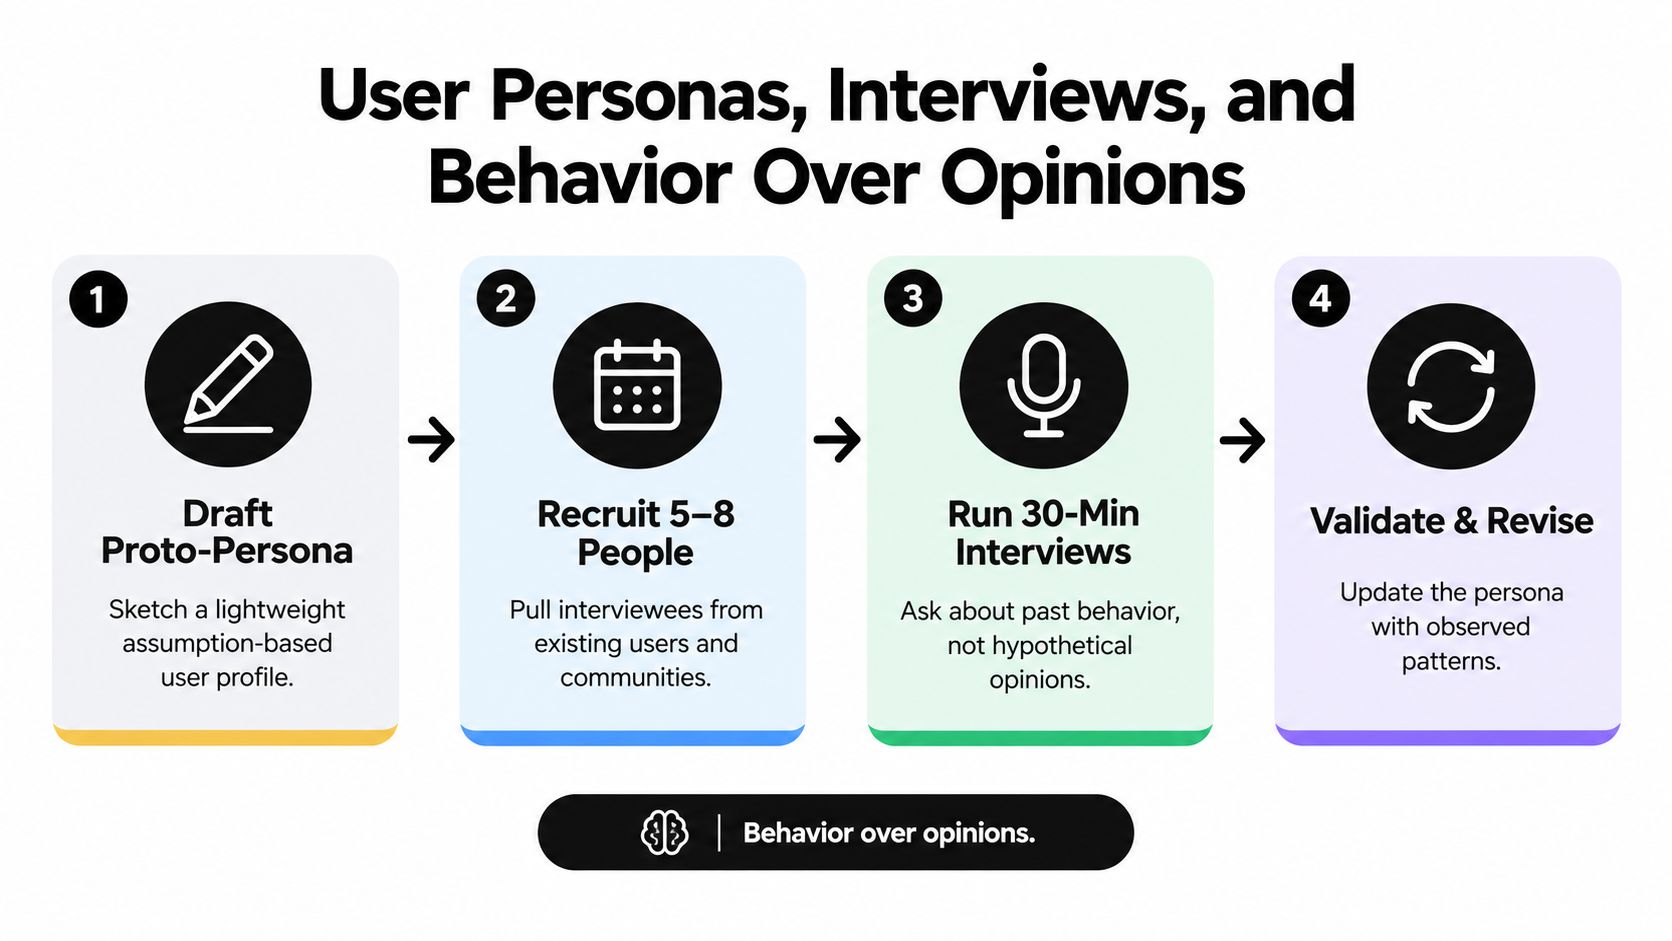
A persona assembled from demographics and imagination will produce polite, predictable answers. Start with a proto-persona, but treat it as a list of assumptions to challenge. The useful persona emerges from what people did recently, what they tried, what failed, and what they paid for.
Recruit five to eight people for 30-minute conversations, using your waitlist, relevant Reddit discussions, community groups, or customer support records where appropriate. Keep the audience narrow enough that you can recognize repeated patterns. A conversation with a vaguely interested general user is usually less valuable than one with a person who recently encountered the problem and built a workaround.
Use a three-part interview script
Context questions establish when and where the problem occurred. Ask about the last incident, the trigger, the surrounding circumstances, and what the person needed to accomplish.
Behavior questions reconstruct the workaround. Which app, search, spreadsheet, message, or manual process did they use? What did they abandon? What did they do next?
Reaction questions come last. Show a rough concept, not a polished sales pitch, and watch for hesitation, confusion, and immediate questions. Don't ask whether they like the idea. Ask what they would do first and what they expect to happen.
Record notes consistently, tag statements by theme, and separate observed behavior from interpretation. A pattern becomes more credible when it appears across three or more sessions, but repetition still needs context. Five people repeating a story after the interviewer leads them toward it isn't strong evidence.
For a practical companion, use this step-by-step buyer persona framework to structure the persona card without turning it into a fictional biography. The final card should include the job to be done, triggering situation, current workaround, frustration, desired outcome, buying signal, and onboarding implication.
Ask about the last time, not the next time. Past behavior carries constraints. Hypothetical enthusiasm usually carries none.
Benchmarking Acquisition, Retention, and Monetization
Benchmarks are useful only when they become product constraints. Pull category medians for retention, session behavior, revenue per user, subscription conversion, and acquisition cost from credible providers such as data.ai, Adjust, and Liftoff's Mobile App Benchmarks report. Compare your closest competitors on the same measures where the data is available, then set a target and a floor.
Don't fill missing values with invented precision. A blank benchmark is more honest than a fabricated median. Use qualitative evidence to define the test, and reserve numerical thresholds for figures you can source or measure directly after launch.
The retention floor deserves special attention. A 2026 summary reports that more than 90% of mobile app users abandon an app before day 30, while another cited benchmark places average day-one retention at around 25% across app categories (Itransition's mobile app statistics summary). Treat those figures as context, not as a universal target. Your category, promise, audience, and usage frequency determine what healthy retention looks like.
Convert benchmarks into prototype requirements
A benchmark sheet should force three decisions:
- Retention constraint: Define the early behavior that must recur, such as completing a daily task or returning to review progress.
- Monetization constraint: Specify the value event that could justify a subscription, purchase, advertising model, or in-app transaction.
- Acquisition constraint: Set the maximum acquisition cost your expected lifetime value can support.
Onboarding is a particularly testable lever. One 2026 UXCam-based summary reports that reducing onboarding from an average of 7 screens to 3 or fewer lowered single-session abandonment from 25% to 14.8%, while instant AI-personalized entry reduced it to 11.2% (Amra and Elma's mobile app retention summary). Use this as a reason to measure friction early, not as a promise that every app will achieve the same result.
| Metric | Category Median | Top Competitor A | Top Competitor B | Year-1 Target | Pivot Floor |
|---|---|---|---|---|---|
| Day-one retention | Source required | Source required | Source required | Defined by team | Defined by team |
| Day-30 retention | Source required | Source required | Source required | Defined by team | Defined by team |
| Session behavior | Source required | Source required | Source required | Defined by team | Defined by team |
| Revenue per user | Source required | Source required | Source required | Defined by team | Defined by team |
| Subscription conversion | Source required | Source required | Source required | Defined by team | Defined by team |
| Acquisition cost | Source required | Source required | Source required | Defined by team | Defined by team |
For channel planning, the Lead Printer guide on customer acquisition offers a useful framework for separating channel choice from acquisition execution. Keep your own category and country assumptions in a living sheet, and use this customer acquisition cost guide when translating paid growth assumptions into a product threshold.
Translating Findings Into a Go or No-Go Decision
Research earns its place only when it forces a decision. Set thresholds before a persuasive stakeholder presents a favorite finding. Otherwise, teams relabel weak evidence as “promising” after spending design time, engineering effort, or personal credibility.
Score four criteria: market access, behavior evidence, monetization viability, and execution risk. Rate each from 0 to 5, apply weights that reflect your strategy, and attach a source or observation to every score. The calculation will not decide the product's future by itself. It will show which assumption carries the case and where the evidence is thin.
| Criterion | Weight | Score (0-5) | Weighted Score | Evidence Source |
|---|---|---|---|---|
| Market access | 25% | Category and platform research | ||
| Behavior evidence | 35% | Interview log and prototype tests | ||
| Monetization viability | 25% | Pricing and competitor evidence | ||
| Execution risk | 15% | Technical and operational review | ||
| Total | 100% |
Make the verdict operational
A Go requires evidence that clears the pre-committed thresholds and a defined scope for the next prototype. A Conditional Go identifies one unresolved assumption, a time-boxed test, and a named owner. A No-Go means the opportunity misses the evidence threshold or depends on an acquisition, retention, or delivery condition the team cannot defend.
Record the decision in a one-page memo:
- Verdict: Go, Conditional Go, or No-Go.
- Evidence: The strongest observed behaviors, market signals, and competitor gaps.
- Prototype scope: The smallest experience that tests the highest-risk assumption.
- Next 30-day actions: Named owners, dates, and expected evidence.
- Kill or pivot signals: Specific results that stop the current plan.
- Open assumptions: Only uncertainties that could change the verdict.
Move from research to a focused prototype quickly. A tool such as RapidNative turns prompts, sketches, images, or PRDs into shareable React Native interfaces, so you can watch users hit the risky flow before engineering commits to it. Pair the prototype with a fast product-idea validation process, and judge observed behavior rather than visual polish.
The memo is a working decision record, not a final report. Update it as interviews, store experiments, prototypes, and early cohorts produce new evidence. The right question is whether the team has enough evidence to commit, plus a clear result that would make it stop. That standard turns market research into a defensible go or no-go decision instead of a feature list.
Ready to build your app?
Turn your idea into a production-ready React Native app in minutes.
Free tools to get you started
Free AI PRD Generator
Generate a professional product requirements document in seconds. Describe your product idea and get a complete, structured PRD instantly.
Try it freeFree AI App Name Generator
Generate unique, brandable app name ideas with AI. Get creative name suggestions with taglines, brand colors, and monogram previews.
Try it freeFree AI App Icon Generator
Generate beautiful, professional app icons with AI. Describe your app and get multiple icon variations in different styles, ready for App Store and Google Play.
Try it freeFrequently asked questions
What is RapidNative?
RapidNative is an AI-powered mobile app builder. Describe the app you want in plain English and RapidNative generates real, production-ready React Native screens you can preview, edit, and publish to the App Store or Google Play.
Can I export the code?
Yes. RapidNative generates clean React Native and Expo code that you can export at any time. No lock-in, no proprietary format. Hand it to your developers or keep building inside RapidNative.
Is RapidNative free to use?
Yes. You can build apps on the free plan with no credit card required. Paid plans unlock unlimited AI generations, code export, and direct publishing to the App Store and Google Play.
Do I need to know how to code?
No. Most users build apps by describing what they want in plain English. Developers can drop into the code whenever they want more control, but coding is optional.
How long does it take to build an app?
Most users have a working first screen in under a minute. A full MVP usually takes a few hours instead of the weeks or months traditional development requires.